INTRODUCTION
Given the epidemiological trend, hypertension’s the high prevalence of hypertension and its link to an increased risk of cardiovascular disease make it a significant global health concern.1 Childhood hypertension is predicted by childhood hypertension, and it has also been noted that childhood hypertension is related to the same lifestyle factors as adults, such as eating habits,2 sedentary activities, and obesity.3 According to the WHO, hypertension is the world third largest cause of mortality.4 According to the findings of a nationwide study, the total prevalence of hypertension in Iraq was 41.5 per 1000 people.5 All patients with chronic hypertension should have their blood glucose levels, serum sodium, potassium, creatinine, calcium, urate, gamma-glutamyl transpeptidase, cholesterol, and triglyceride (TG) concentrations assessed. In most cases, they can be assessed while not fasting.6 Some biochemical markers, such as electrolytes, C-reactive protein, and serum bilirubin levels, may be associated to hypertension, according to the study by.7 Oberleithner et al. investigated how a slight increase in plasma sodium content may influence the pressure response to dietary salt. The purpose of this research was to investigate the relationship between serum electrolytes, glucose, proteins, and lipid profile parameters with blood pressure and also to find whether there is any relationship between amino acid sequencing and blood pressure among hypertension males compared to normotension in the camps of Nineveh province.
MATERIALS AND METHODS
Study design
During the academic year 2020–2021, a clinical screening program for hypertension was conducted in the camps of Nineveh Province, Iraq, with 118 hypertension patients and 100 normotension controls. The age range was 30–70 years. All of the study subjects gave their permission after receiving approval from the ethical committee. Blood pressure was measured with a mercury sphygmomanometer (Diamond Deluxe BP device, Pune, India) in itting position in the right arm using both palpatory and auscultatory methods. The average of the three recordings was obtained.
Sample collection
Venipuncture was used to acquire a sample of 10 mL of venous blood from each patient, which was then left to coagulate for one hour at room temperature. The serum was separated by rotating the tubes at 3000 rpm using a rotary centrifuge for 15 min. Blood samples were immediately separated into aliquots and kept at -70°C until tests were performed.
Biochemical tests analyses
The serum electrolyte analyses, sodium and potassium levels in the blood were determined using the traditional flame photometric technique. Chloride (Cl−) was calculated using the Schales and Schales titrimetric approach, as described by.8 Focal segmental glomerulosclerosis, total protein, calcium, total cholesterol (TC), TG, and high-density lipoprotein cholesterol (HDL-C) were quantified using kits from the French company Biolabo.
-
Low-density lipoprotein cholesterol (LDL-C) was calculated using the equation shown below
LDLc = TC HDLc TG/5
-
The very low-density lipoprotein VLDL) level was calculated using the below formula.9
TG/5 = VLDL
Extraction and analysis of amino acids
The amino acids were extracted using the scientist’s procedure, which included taking 3 g of weight from the sample and placing it in a 10 mL volumetric vial, adding 3mL of 6ml hydrochloric acid with 0.1%phenol, and mixing it. After incubation for 24 h in a thermal oven at 45°C, 3 mL sodium hydroxide and 0.1 mg citric acid were added and mixed well for 15 min. A 0.45 µm plastic filter was used to filter the sample before it was delivered to the injection device. 1 ml of the extracted material was diluted with 200 mL orthophthalmea aldehyde.10 Stir for 2 min before injecting 100 mL of the resulting into the instrument (amino acid analysis). The test was carried out at the laboratory of Department of Environment and Water, Ministry of Science and Technology using an amino acid analyzer (Amino acid analyzer of Korean origin; Scriver technique was utilized). At a flow rate of 1 mL/min, the carrier phase comprising methanoyl, acetonitrile, and 5% formic acid in the proportions 20:60:20 was utilized (ZORBAXEclipseAAA3.μl ×id = 150×4.6 mm). To identify and separate the amino acids, a fluorescent reagent with wavelengths of Ex = 445 nm and Em = 465 nm was used, and Clarity 2015 Software was used to evaluate acids Amin.11
Statistical analysis
Data were obtained, processed, and statistically analyzed using IBM SPSS statistical® 26.0 software to create cross-tabs and generate applicable findings. Continuous variable outcomes were described using the mean standard deviation. An independent t-test was used to evaluate variable groups based on the observed data. It was regarded as significant when the P (t-test) result was less than 0.05, while it was judged nonsignificant when it was more than 0.05.
RESULTS
The results of systolic or diastolic blood pressure (mm Hg) measurements of males hypertension patients and normotension males as healthy controls are shown in Table 1. The blood pressure for males with hypertension was significantly higher (P < 0.05) than that of healthy controls (table 1).
TABLE 1. The levels of electrolytes, glucose, and total protein in hypertension and normotension males.
| Statistical parameters Biochemical tests | Males hypertension | Males normotension | P | Significance | ||
|---|---|---|---|---|---|---|
| 30-50 years | 50-70 years | 30-50 years | 50-70 years | |||
| Mean ± SD | Mean ± SD | Mean ± SD | Mean ± SD | |||
| Systolic blood pressure (mm Hg) | 144.97 ± 1.99 | 146.21 ± 2.96 | 126.1 ± 3.14 | 129.46 ± 2.13 | <0.05 | Significant |
| Diastolic blood pressure (mm Hg) | 97 ± 3.25 | 99.4 ± 2.65 | 87 ± 1.87 | 88 ± 2.58 | <0.05 | Significant |
| Sodium (mEq/L) | 153.57 ± 22.5 | 168.39 ± 23.1 | 113.22 ± 21.47 | 122.63 ± 23.75 | <0.05 | Significant |
| Potassium (mEq/L) | 49.76 ± 3.19 | 69.83 ± 3.72 | 4.35 ± 2.19 | 5.81 ± 2.94 | <0.05 | Significant |
| Chloride (mEq /L) | 110.17 ± 14.8 | 122.45 ± 13.9 | 96.09 ± 14.49 | 101.38 ± 13.73 | <0.05 | Significant |
| Calcium (mg/dl) | 8.53 ± 1.87 | 9.39 ± 2.03 | 9.59 ± 2.53 | 8.07 ± 2.86 | <0.05 | Non-Significant |
| Glucose (mg / dl) | 113.75 ± 45.3 | 116.5 ± 42.7 | 90.5 ± 32.8 | 98.64 ± 39.91 | <0.05 | Significant |
| Total Protein (g/dl) | 7.34 ± 1.24 | 7.53 ± 0.78 | 6.57 ± 2.43 | 7.94 ± 2.07 | <0.05 | Non-Significant |
SD, standard deviation.
Table 1 summarized the results of electrolytes, glucose, and total protein in males with hypertension compared to normotension males. The results revealed that the electrolytes such as sodium (mEq/L), potassium (mEq/L), and chloride (mEq/L) significantly increased (P < 0.05) in 50-70 years age group (168.39 ± 23.1, 69.83 ± 3.72, and 122.45 ± 13.9, respectively) than in the age group 30-50 years (153.57 ± 22.5, 49.76 ± 3.19, and 0.17 ± 14.8, respectively) compared to normotension males or healthy controls. The calcium (mg/d L) levels showed a relative increase in the (50–70) years age group (9.39 ± 2.03) than in the 30–50 years age group (8.53 ± 1.87) with no-significance compared to normotension males (healthy controls). Serum glucose (mg/dL) increased in males with hypertension in (50–70) years age group (116.5 ± 42.7) than in (30–50) years (113.75 ± 45.3) age group and showed a significant (P< 0.05) increase compared to healthy controls. The total protein levels (g/dL) in males with hypertension showed non-significant (P < 0.05) results when compared to normotension males (healthy controls). See table 1.
The results of TG, cholesterol, HDL, LDL, and VLDL in males with hypertension compared to normotension are shown in Table 2. The results revealed a significant (P < 0.05) increase in TG (mg/dl), cholesterol (mg/dl), LDL (mg/dl), and VLDL (mg/dl) in the (50–70) years age group (226.0± 61.6, 383.0 ± 67.2, 142.7 ± 39.5, and 31.46 ± 21.41, respectively) than in the (30-50) years age group (217.0 ± 58.1, 346.0 ± 74.8, 133.5 ± 40.1, and 28.88 ± 20.37, respectively). The HDL (mg/dl) levels decreased in the 50-70 years age group (36.7 ± 4.8) than in the 30-50 years age group (38.3 ± 5.9) compared to normotension males healthy controls.
TABLE 2. The levels of lipid profile in males hypertension and males normotension.
| Statistical parameters Biochemical tests | Male hypertension | Male normotension | P | Significance | ||
|---|---|---|---|---|---|---|
| 30-50 years | 50-70 years | 30-50 years | 50-70 years | |||
| Mean ± SD | Mean ± SD | Mean ± SD | Mean ± SD | |||
| Triglycerides (mg/dl) | 217.0 ± 58.1 | 226.0 ± 61.6 | 113.8 ± 41.3 | 117.0 ± 43.9 | <0.05 | Significant |
| Cholesterol (mg/dl) | 346.0 ± 74.8 | 383.0 ± 67.2 | 205.62 ± 42.39 | 213.2 ± 69.7 | <0.05 | Significant |
| HDL (mg/dl) | 38.3 ± 5.9 | 36.7 ± 4.8 | 69.6 ± 13.73 | 57.6 ± 18.48 | <0.05 | Significant |
| LDL (mg/dl) | 133.5 ± 40.1 | 142.7 ± 39.5 | 101.5 ± 19.8 | 103.4 ± 43.1 | <0.05 | Significant |
| VLDL (mg/dl) | 28.88 ± 20.37 | 31.46 ± 21.41 | 30.62 ± 24.03 | 32.73 ± 22.32 | <0.05 | Significant |
HDL, high-density lipoprotein; LDL, low-density lipoprotein; SD, standard deviation; VLDL, very low-density lipoprotein.
The long list of secondary metabolite compounds in humans indicates the amino acids content. The results of chromatographic loading in a serum sample of a male with hypertension revealed the availability of many amino acids. amino acids were identified as aspartic acid, glutamic acid, glycine, histidine, serine, arginine, methionine, alanine, isoleucine, proline, phenylalanine, leucine, and lysine with retention times 3.78, 4.18, 4.92, 7.50, 8.19, 10.49, 14.77, 15.37, 17.46, 18.58, 22.36, 24.28, and 27.36 min respectively at concentrations 27.4, 37.4, 14.9, 7.2, 11.9, 29.2, 5.6, 15.6, 10.1, 15.6, 11.3, 9.2, and 22.9 ug/g respectively. See Table 3.
FIG 1. Retention time and voltage of amino acids in hypertension patients using amino acid anaylzer.
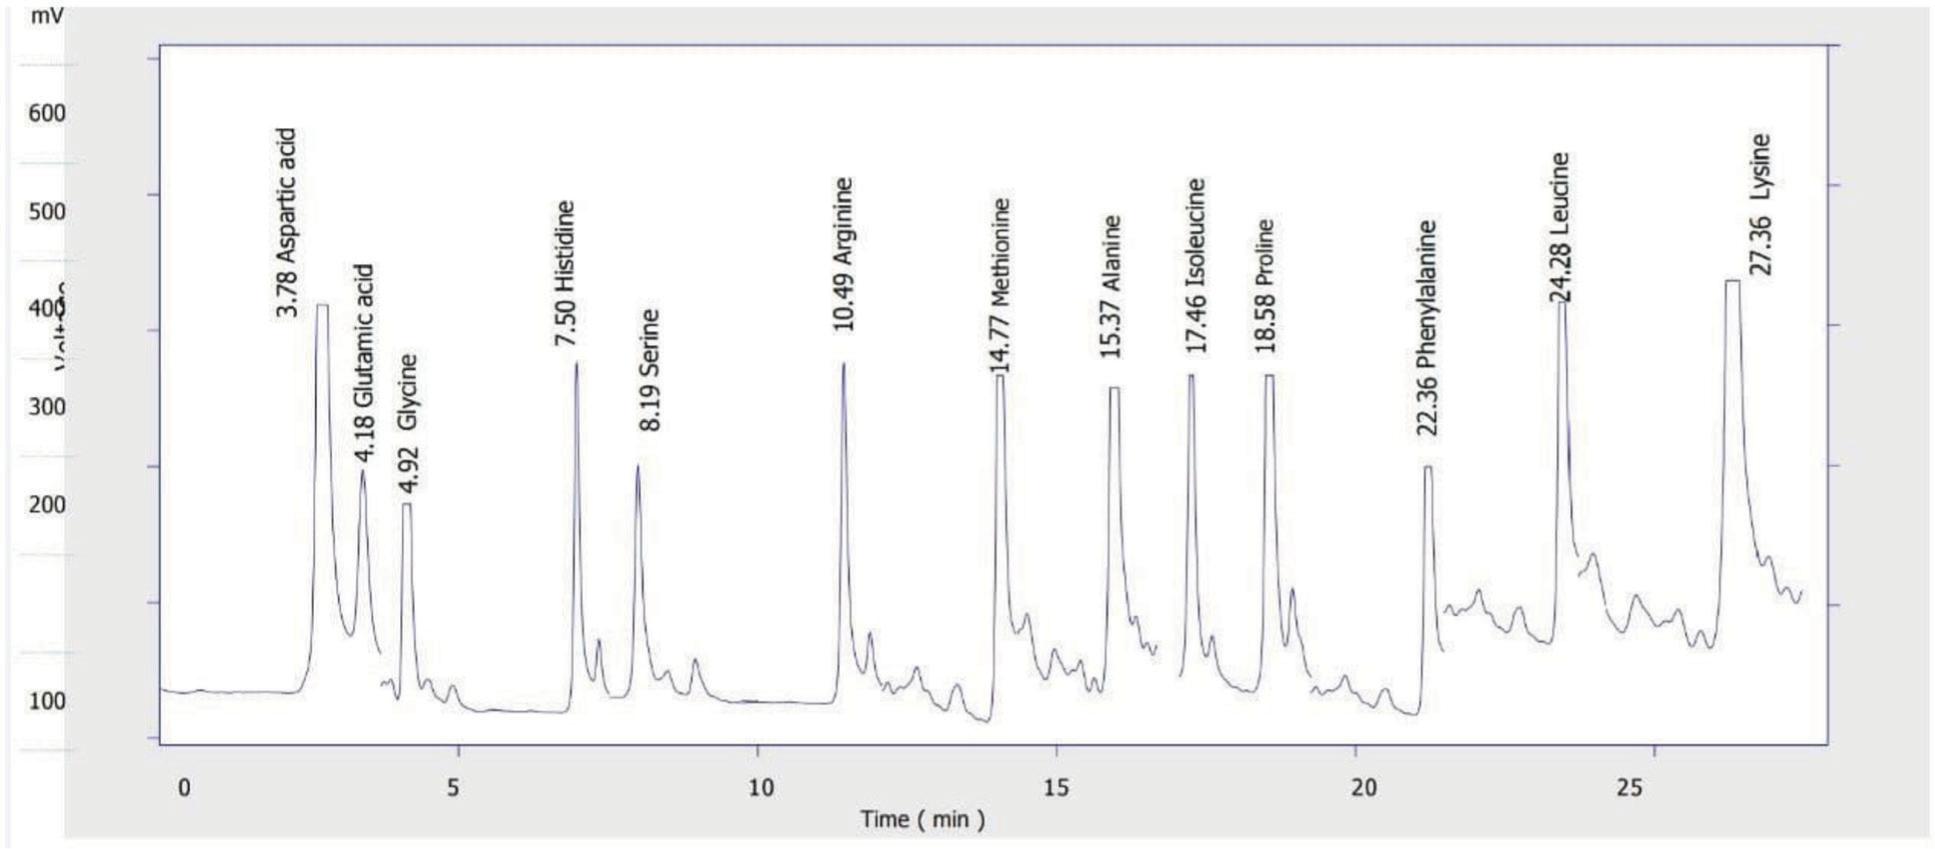
TABLE 3. Retention time, amount, and response of amino acids in hypertension patients using amino acid analyzer.
| Seq | Compound name | Retention time (min) | Amount (ug/g) | Response |
|---|---|---|---|---|
| 1 | Aspartic acid | 3.78 | 27.4 | 968.7 |
| 2 | Glutamic acid | 4.18 | 37.4 | 854.7 |
| 3 | Glycine | 4.92 | 14.9 | 963.5 |
| 4 | Histidine | 7.50 | 7.2 | 1147.5 |
| 5 | Serine | 8.19 | 11.9 | 879.4 |
| 6 | Arginine | 10.49 | 29.2 | 924.6 |
| 7 | Methionine | 14.77 | 5.6 | 1245.6 |
| 8 | Alanine | 15.37 | 15.6 | 865.4 |
| 9 | Isoleucine | 17.46 | 10.1 | 1365.5 |
| 10 | Proline | 18.58 | 15.6 | 964.1 |
| 11 | Phenylalanine | 22.36 | 11.3 | 852.4 |
| 12 | Leucine | 24.28 | 19.2 | 961.0 |
| 13 | Lysine | 27.36 | 22.9 | 879.6 |
The results of chromatographic loading in another male hypertension patient showed the availability of many amino acids in the serum sample, and they were diagnosed as aspartic acid, glutamic acid, asparagine, serine, histidine, glycine, arginine, alanine, methionine, valine, phenylalanine, and leucine with retention times 7.93, 9.17, 9.92, 10.55, 11.84, 13.35, 13.97, 15.14, 16.55, 17.14, 19.84, and 22.15 min respectively at concentrations 50.3, 23.2, 63.5, 14.1, 21.6, 34.7, 40.3, 25.6, 47.2, 53.6, 22.7, and 19.9 ug/g respectively. See Table 4.
FIG 2. Retention time and voltage of amino acids in hypertension patients using amino acid analyzer.
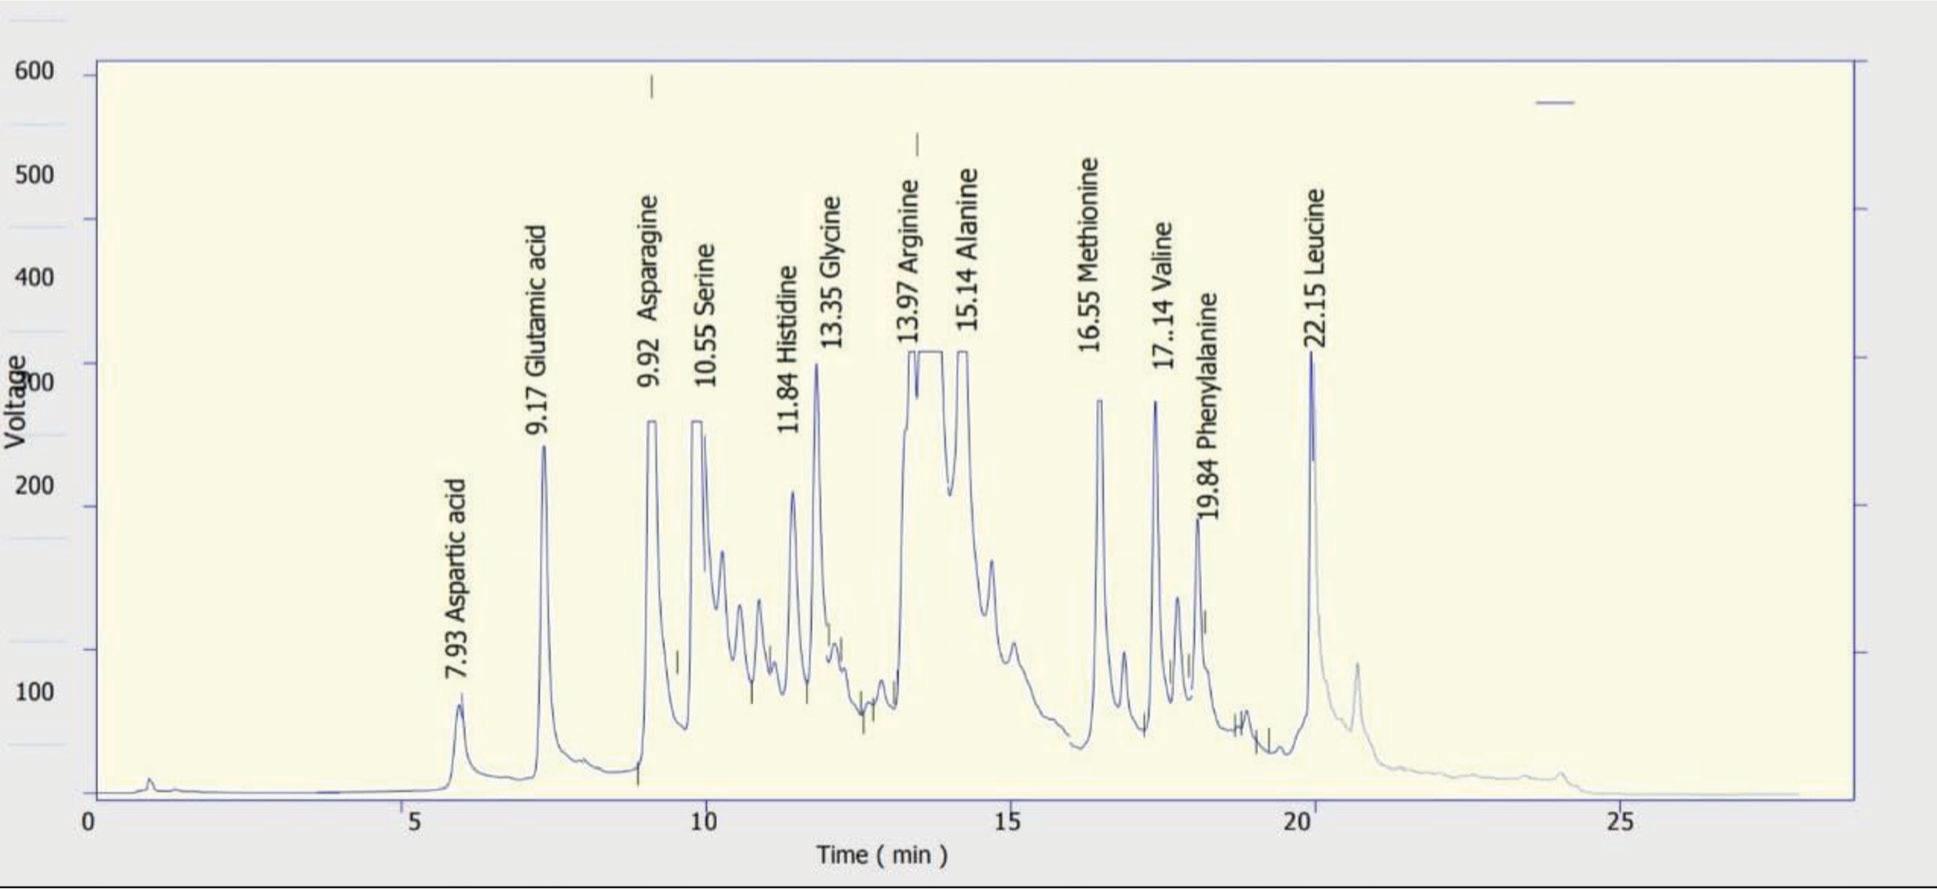
TABLE 4. Retention time, amount, and response of amino acids in hypertension patients using amino acid analyzer.
| Seq | Compound name | Retention time (min) | Amount (ug/g) | Response |
|---|---|---|---|---|
| 1 | Aspartic acid | 7.93 | 50.3 | 120.51 |
| 2 | Glutamic acid | 9.17 | 23.2 | 516.9 |
| 3 | Asparagine | 9.92 | 63.5 | 157.8 |
| 4 | Serine | 10.55 | 14.1 | 226.9 |
| 5 | Histidine | 11.84 | 21.6 | 114.8 |
| 6 | Glycine | 13.35 | 34.7 | 269.8 |
| 7 | Arginine | 13.97 | 40.3 | 256.9 |
| 8 | Alanine | 15.14 | 25.6 | 241.5 |
| 9 | Methionine | 16.55 | 47.2 | 126.9 |
| 10 | Valine | 17.14 | 53.6 | 198.7 |
| 11 | Phenylalanine | 19.84 | 22.7 | 136.9 |
| 12 | Leucine | 22.15 | 19.9 | 148.9 |
DISCUSSION
This study illustrated that there were a significant elevation in sodium and chloride as it shown in table 1 which was agree with those of12, 13, 14 have been showed similar results. Blood pressure and sodium chloride have a complicated relationship. Guyton et al. proposed that in essential hypertension, higher blood pressure is necessary to maintain renal balance and salt excretion. The majority of long-term investigations of salt restriction in humans have revealed a shift in blood pressure, particularly in salt sensitive individuals. Furthermore,in chimps, there is a clear link between salt ingestion and blood pressure.15 There is a significant correlation between salt intake and blood pressure in the Far East, where salt consumption is often high.16 As a result, we conducted a prospective study of hypertension patients in the camps of Nineveh province to see if some biochemical parameters acted as contributing factors.
Our results supported the conclusions by earlier studies that diastolic blood pressure and salt excretion have an unexpected association,16, 17 and these findings added to the growing body of evidence that this is a real phenomenon in this region of the world. Nonetheless, our findings are valid for a variety of reasons. First of all, before controlling the characteristics such as age, the link between diastolic blood pressure and salt excretion was significant, and this remained-significant even after adjusting the variables. Second, the association between salt excretion and diastolic blood pressure remained significant even after correcting for regression dilution bias. Final results showed a significant link with very similar correlation and regression coefficients between ambulatory blood pressure readings and blood pressure readings repeated after a 12-week interval. Furthermore, ambulatory blood pressure measurement decreased observer bias. This study found that serum calcium levels are unrelated to blood pressure and that hypertensives had somewhat lower calcium levels in their blood. These findings are comparable to those of Kosch et al,18 who found no difference in serum calcium levels in hypertension patients. However, Sudhakar et al, Elliot et al, and Al-Muhana et al,19, 20 found that calcium had an inverse relationship with blood pressure and lower serum levels in hypertension males. Changes in intracellular calcium are hypothesized to have a role in the common route that mediates the production and activity of multiple hormones, including catecholamines and angiotensin II pressor effect. Blood pressure control may be aided by intracellular calcium. The pathophysiology of essential hypertension is influenced by calcium-regulating hormones such as 1,25 di- hydroxy vitamin D, plasma renin activity, and circulating ionized calcium.19 The study by Reichel et al. found lower calcium levels in men with high diastolic blood pressure. According to the results of this study, hypertension patients had much higher mean blood levels of TC, TG, and LDL than normotension males. This difference was statistically significant. Typical HDL levels in hypertension was lower than in normotension, and the difference was statistically significant. This finding is comparable to the previous studies.21 Furthermore, our findings were consistent with those of previous investigations.22, 23, 34 Few research, however, have looked at the significant link between hypertension and dyslipidemia in the Iraqi community. According to the INTERHEART research, Asians had mean LDL values that were around 10 mg/dL lower than non-Asians in both patients and controls.23, 25 LDL levels below 100 mg/dL were found in a higher percentage of Asian patients and controls. Asians had somewhat lower HDL levels than non-Asians, indicating that this group needed further research and tailored care (Karthikeyan et al., 2009).23 According to several studies, the majority of hypertension patients get inconsistent treatment, and blood levels of TC, TG, HDL, and LDL are noticeably unstable in these people.22
On other hand, to the best of our knowledge, no research has been done on the relationship between amino acid patterns and hypertension. The study by Stamler et al.34 discovered a connection between dietary glutamic acid and lower systolic and diastolic blood pressure, with greater amounts of glutamic acid in the diet . The results of a Dutch study that revealed no correlation between dietary glutamic acid and blood pressure levels or the prevalence of hypertension are in direct conflict with this observation.27 Methionine and alanine have been linked to an increased risk of high blood pressure in previous researches;16 however, results on glycine are mixed.28 Cysteine and glycine, for example, reduce blood pressure by increasing glutathione production and interacting with excess aldehydes.27 Additionally, when comparing the highest quartile of glycine versus. the lowest, we found a nonsignificant inverse relationship in all participants; however, in subjects aged 30 years and above, we found a significantly lower risk of hypertension when compared to the highest quartile of glycine versus. the lowest; there was also a protective relationship between cysteine and hypertension in this age group. Finally, there were some limitations to our research. First, the sample size was obtained from camps, and it is possible that it does not represent all hypertension patients in the camps of Nineveh province. Second, our sample size was limited, and the control group was purposefully chosen because it was not age matched. Furthermore, we were unable to examine the effects of changes in lipid profiles induced by diet, physical activity, medicine, or other factors.
CONCLUSION
Our findings revealed that in hypertensive patients, sodium, potassium, chloride, and lipid profile are highly related to diastolic blood pressure.