INTRODUCTION
Sirolimus (SRL) or rapamycin is an immunosuppressive agent approved for the prophylaxis of graft rejection in kidney transplant patients aged 13 years or more and for the treatment of patients with lymphangioleiomyomatosis.1 Moreover, SRL exerts anti-tumor action, and recently its derivative, temsirolimus (TEM) or CCI-779, has been developed to treat advanced renal cell carcinoma.2 Though SRL has a similar structure to tacrolimus and binds to FK-binding protein, SRL/FK-binding protein complex does not affect calcineurin phosphatase. Instead, it binds to mammalian targets of rapamycin (mTOR), leading to the inhibition of the progression of the cell cycle from the G1 to the S phase.1,3,4
Following oral administration in stable renal transplant patients, the time to peak concentration (Tmax) is variable, ranging from 0.5 to 3 hours,5 however, the bioavailability is low with a value of approximately 15.0%.5,6 In blood, SRL is preferentially distributed to red blood cells (94.5%) in a concentration-independent manner,7 with the mean blood to plasma ratio of 34.5:1 in stable kidney transplant patients receiving a single oral dose, nonetheless, this ratio is substantially variable ranging from 10 to 70.8 In contrast, in the plasma, approximately 40.0% of the drug is bound to lipoproteins,5 therefore, based on the nature of SRL, therapeutic drug monitoring (TDM) should be performed using whole blood as the appropriate biological matrix. Moreover, due to the lipophilic property, SRL is extensively distributed in lipid membranes of various organs, resulting in a high volume of distribution (Vd) of 5.6–16.7 L/kg in stable renal transplant patients.8
SRL is extensively metabolized by CYP3A4 and CYP3A5. Also, it is a substrate of P-glycoprotein (P-gp), which contributes to its low oral bioavailability.5 Moreover, CYP3A5 also plays a role in SRL metabolism.9 The drug exhibits large interindividual variability (IIV) in metabolism, with the apparent clearance ranging from 0.090-0.416 L/h/kg in stable renal transplant patients receiving a 14-day course of SRL with cyclosporine and prednisolone.8 The elimination half-life (t1/2) was approximately 62 hours;8 thus, the steady-state condition is achieved within 1-2 weeks.
Based on preclinical and clinical studies, the efficacy and adverse effects of SRL are related to blood concentrations, with trough concentrations at steady-state (Css,tr) of greater than 5 µg/L associated with an 89.5% negative predictive value for the occurrence of acute rejection episodes, while Css,tr levels greater than 15 µg/L are related to toxicity such as leucopenia, thrombocytopenia, and hypertriglyceridemia.10,14 This suggests that Css,tr of SRL should be maintained within the range of 5-15 µg/L to achieve an optimal therapeutic outcome,5 and thus TDM is an essential process during SRL therapy.
Since it takes approximately one week for SRL to reach steady-state condition, and a dosage adjustment based on the target Css,tr cannot be performed sooner, a population pharmacokinetic (PopPK) approach can be conducted to aid dosage individualization. This approach and the Bayesian estimation can provide individual pharmacokinetic parameter estimates for the optimization of SRL therapy. To date, several PopPK studies of SRL have been developed to characterize factors influencing SRL pharmacokinetic variability,9,15–29 however, significant predictors obtained from these studies are not consistent; for example, some studies identified a significant effect of gender on SRL clearance (CLSRL)27 and Vd25, but other studies could not find such the effects.15,17,19,21,24 Based on the conflicting results, we aimed to systematically summarize factors that significantly influence SRL pharmacokinetic variability and their relationships with pharmacokinetic parameters. In addition, the disparity of model methodologies across studies was also reviewed and discussed.
METHODS
Database Searching and Study Selection
CINAHL Complete, PubMed, Science Direct, and SCOPUS databases were systematically searched to identify apposite studies. The search spanned the period from the database’s inception to May 2021. Search terms were developed using the PICO framework as follows: P: human studies, I: sirolimus OR Rapamune or rapamycin, C: none, O: “population pharmacokinetics” OR “pharmacokinetic model” OR “nonlinear mixed effect” OR NONMEM OR “interindividual variability” OR “intersubject variability” OR “residual variability” OR “intrasubject variability.” Reference lists were also screened for additional studies.
Title and abstracts were screened to exclude non-relevant articles. Screening of full-text articles was subsequently performed to identify studies to be included in this systematic review based on the following inclusion criteria: 1) PopPK studies conducted in humans, 2) SRL was used as a treatment drug, and 3) studies conducted using a nonlinear mixed-effects approach, while the exclusion criteria included: 1) non-English or non-Thai articles, 2) information on model development methodology was not sufficient, and 3) studies that were not original research articles. The Preferred Reporting Items for Systematic Reviews and Meta-analyses (PRISMA) guideline was adopted and followed during the review process.
Data Extraction
JM, PA, and RK independently extracted the data using the data abstraction form developed by JM. The extracted data were discussed, and the consensus was made by all authors. Three data categories were extracted, which included: 1) population characteristics such as study design, sample size, underlying diseases, age, body size, sex, functions of elimination organs, measurements of relevant laboratory values; 2) pharmacokinetic related information, that is, SRL dosage regimens, concurrent medications, analytical methods of SRL concentrations, and sampling strategy which is categorized into sparse sampling if the number of samples per patients was less than 6, otherwise it was considered an extensive sampling approach, and 3) model development methodologies and model evaluations. For model development, structural and statistical models for IIV and residual variability (RV) were summarized. In addition, tested and significant covariates on SRL pharmacokinetic parameters were compared across studies. Model evaluations were classified into three categories including basic internal, advanced internal, and external evaluation, as previously described by Brendel et al.30
Transparent Report and Clarity of the Included Studies
All reviewers independently assessed the study report quality using the Clinical PK checklist developed by Kanji et al.31 and the PopPK model-building strategies introduced by Dartois et al.32
RESULTS
Study Identification
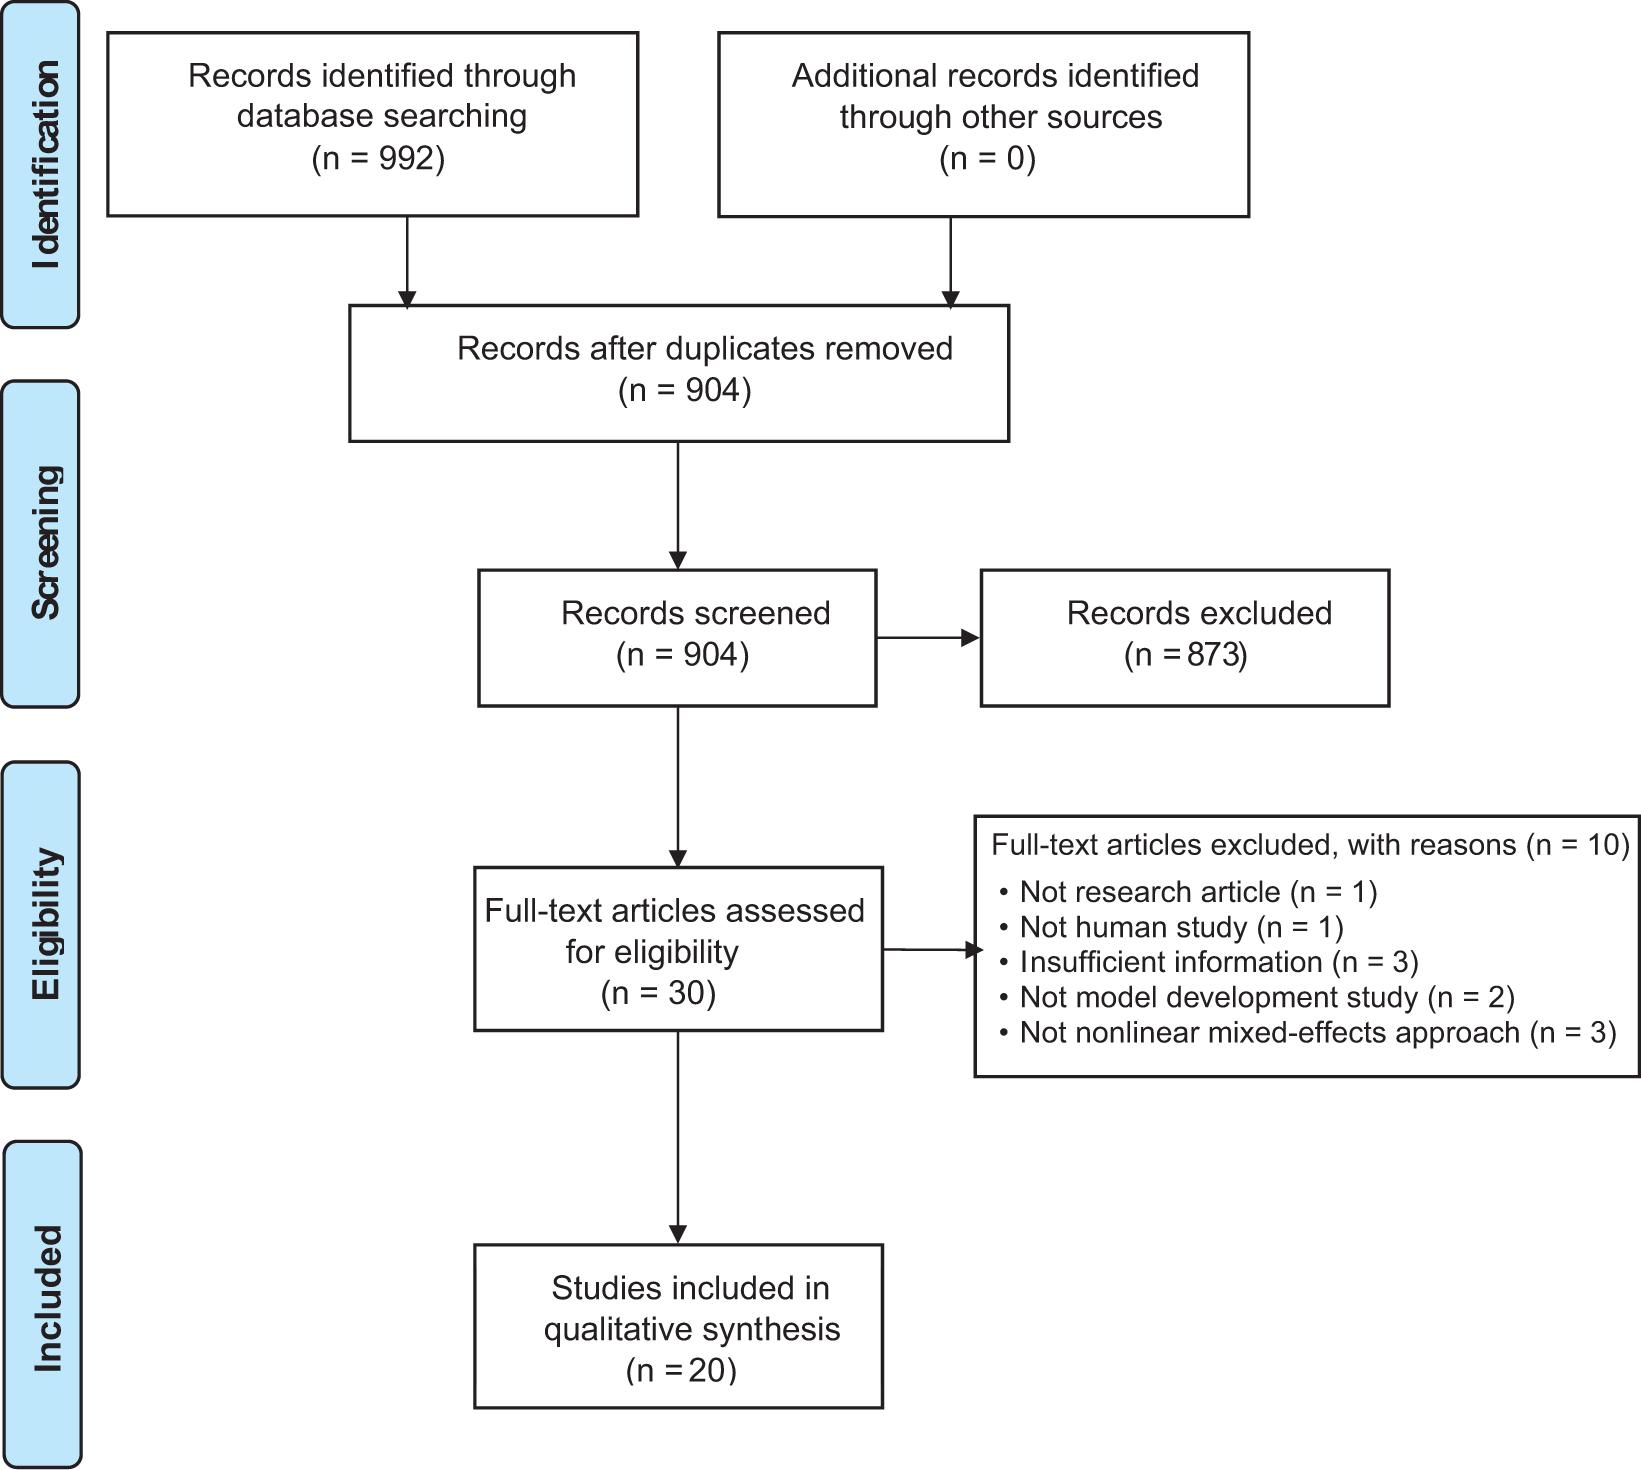
Based on the systematic search, 992 articles were identified from all databases. Following the removal of duplicates, titles and abstracts of 904 non-redundant studies were screened, and 873 articles were excluded as irrelevant, leaving 31 studies for full-text assessment. Of these, 20 studies published between 1997 and 2021 met the inclusion criteria and were included in this review. Details on study exclusion are summarized and presented in a PRISMA diagram (Figure 1).
Figure 1. A PRISMA diagram of the study identification.
Population Characteristics, Study Design, and Pharmacokinetic Data
Most SRL PopPK studies were performed on various types of transplant patients, including kidney transplants,9,15,17,20,26 heart transplants,19 pancreatic islet transplants,18 and bone marrow transplants,22 while cancer was the second most disease in which SRL PopPK studies were conducted,21,27,28,33–35 which included renal cell carcinoma, Kaposiform hemangioendothelioma, and several types of advanced or recurrent solid tumor, and of these two studies developed SRL PopPK models as an active metabolite of TEM.33,34 Other underlying diseases included immune cytopenia,29 tuberous sclerosis complex,36 and vascular anomalies.23,24 Moreover, one study was conducted solely on healthy Chinese subjects,25 and the other one was performed in both healthy Chinese and kidney transplant patients.37 In terms of age category, respective nine and 11 studies were conducted on children and adults. Most SRL PopPK studies were conducted to characterize SRL pharmacokinetics and its variability, but a few studies specifically aimed to determine the initial SRL dose using the developed PopPK models28,36 or create a Bayesian estimator for estimating an individual’s pharmacokinetic parameters.17 The sample sizes of the included studies ranged from 6 to 127 subjects, with half of the included studies retrospectively conducted using data from a clinical trial19–21,23,34,37 and TDM data,26–28,36 while the rest of the studies were prospective.9,15,17,18,22,24,25,29,33 Most studies used sparse sampling strategy,9,18,20,23,24,26–29,36 whereas six and four studies employed an intensive sampling approach15,17,22,25,34,35 and a mixture of both intensive and sparse sampling.19,21,33,37 Concerning bioassay, most studies used liquid chromatography with tandem mass spectrometry (LCMS/MS),17,19–21,23–25,33,34,37 mass spectrometry (MS),15,22,33,35 or high performance liquid chromatography with ultraviolet detector (HPLC/UV),18,20 whereas the rest utilized various types of immunoassays.9,26–29,36 Table 1 summarizes population characteristics, study design, and pharmacokinetic data.
Table 1. Population characteristics, study design, and pharmacokinetic data.
| No | Author | Study design | Study site | Patient characteristics | N (male) | Mean age (range) years | Mean weight (range) kg |
Mean BSA (range) m2 | Route | Sampling strategy | Bioassay |
|---|---|---|---|---|---|---|---|---|---|---|---|
| 1 | Ferron et al., 199715 | Randomized, double-blind, placebo-controlled ascending single-dose study | Multicenter | KT: high risk of chronic rejection | 12 (11) | 52.3 ± 24 | 73.9 ± 17.5 | 1.87 ± 10.1 | Oral | Intensive | HPLC/MS |
| KT: compromise kidney function | 12 (11) | 51 ± 25.5 | 78.2 ± 28.7 | 1.90 ± 15.7 | |||||||
| KT: stable transplant | 12 (9) | 43.3 ± 29.0 | 75.6 ± 18.9 | 1.88 ± 10.0 | |||||||
| 2 | Boni et al., 200533 | Randomized, double-blind, multicenter trial, once-weekly IV infusion | Multicenter | Advanced renal cell carcinoma | 50 (33) | 57.9 ± 9.6 (40-81) |
82.9 ± 17.1 (53.7-124.7) |
1.97 ± 0.2 (1.62-2.45) |
IV inf. (30 min) | Intensive and Sparse | LCMS/MS |
| 3 | Djebli et al., 200617 | Prospective | Adult KT | 22 (13) | 48.6 (20-69) | Wk 1: 60 (48-90) Wk 2: 63 (48-90) Mth 1: 58 (41-90) Mth 2: 58 (41-90) |
Oral | Intensive | HPLC-MS/MS | ||
| 4 | Sato et al., 200618 | Prospective | Single-center | Pancreatic islet transplant | 6 (2) | Med: 39 (35-58) |
Med: 57 (37-30) |
Oral | Sparse | HPLC/UV | |
| 5 | Zahir et al., 200619 | Retrospective of heart transplant trial | Multicenter | Adult heart transplant with or without ischemic heart disease | 31 (24) | 49.0 ± 12.0 (18-66) |
78.3 ± 12.7 (51-12.5) |
Oral | Intensive and Sparse | LCMS/MS | |
| 6 | Jiao et al., 200920 | Retrospective of clinical trial | Multicenter | Chinese adult KT | 112 (78) | 42 ± 9.9 | 60.4 ± 9.43 | 1.7 ± 0.144 | Oral | Intensive | LCMS/MS and HPLC/UV |
| 7 | Wu et al., 201221 | Retrospective of clinical trial | Single-center | Patients with advanced solid tumors | 76 (39) | 57.7 (22-83) |
79.76 (32.8-154.6) |
Oral | Sparse | LCMS/MS | |
| 8 | Goyal et al., 201322 | Prospective | Multicenter | Pediatric blood and bone marrow transplant | 37 (27) | Med: 10.1 ± 5 (4-22) | Med: 34.8 ± 19 (13.2-84.3) |
Oral | Sparse | HPLC/MS | |
| 9 | Shi et al., 20169 | Prospective | Single-center | Chinese adult KT | 108 (79) | 47±11 (21-72) |
58.8 ± 5 (45-72) |
Oral | Intensive | MEIA | |
| 10 | Emoto et al., 201623 | Retrospective of clinical trial | Neonates and infants with complicated vascular anomalies | 52 (20) | Med: 4.8 (0.058-19) |
Med: 18 (4-101) |
Med: 0.77 (0.23-2.2) |
Sparse | LCMS/MS | ||
| 11 | Mizuno et al., 201634 | Retrospective of clinical trial | Children with recurrent solid tumor | 19 (11) | 11.9 ± 5.7 (21 days-19 years) |
45.7 ± 28 (7.3-114.7) |
IV inf. (15-60 min) | Intensive and Sparse | LCMS/MS | ||
| 12 | Mizuno et al., 201724 | Prospective | Multicenter | Pediatric patients with vascular anomalies | 52 (20) | Med:4.9 (0.1-18.6) |
Med: 18.4 (4-100.6) |
Oral | Intensive | LCMS/MS | |
| 13 | Wang et al., 201637 | Retrospective of bioavailability and post-market study | Multicenter | Healthy Chinese and KT patients | 127 (89) | 37.44±1.02 (19-64) |
62±0.91 (37-89) |
Oral | Sparse | LCMS/MS | |
| 14 | Peng et al., 201825 | Prospective | Single-center | Healthy Chinese subjects | 27 (12) | Med: 25.48 (20-36) |
Med: 61.93 (45-75) |
Med: 1.71 (1.45-1.93) |
Oral | Sparse | LCMS/MS/MS |
| 15 | Golubovic et al., 201926 | Retrospective of TDM data | Single-center | Adult KT | 25 (18) | 43.22 ± 12.62 (16-64) | 77.07 ± 18.76 (44-128) |
Sparse | CMIA | ||
| 16 | Wang et al., 201927 | Retrospective of TDM data | Single-center | Pediatric Chinese patients with KHE | 17 (11) | 1.21 ± 1.2 (0.2-6) |
7.99 ± 3.04 (3.6-18) |
Oral | Sparse | EMIT | |
| 17 | Chen et al., 202028 | Retrospective | Single-center | Pediatric Chinese patients with KHE | 14 (9) | 1.53 ± 1.40 | 8.87 ± 4.12 | Oral | Sparse | EMIT | |
| 18 | Chen et al., 202029 | Prospective | Single-center | Children with immune cytopenia | 27 (18) | 8.16 ± 3.60 | 27.03 ± 10.87 | Oral | Sparse | FPIA | |
| 19 | Wang et al., 202036 | Retrospective | Single-center | Children with tuberous sclerosis complex | 15 (7) | 6.16 ± 2.80 | 23.83 ± 8 .88 | Oral | Sparse | EMIT | |
| 20 | Sabo et al., 202135 | Prospective | Multicenter | Pediatric oncology | Day 1: 27 (16) | 11.7 ± 5.9 | 38.5 ± 18.6 | Oral | Intensive | Reverse phase LCMS | |
| Day 8: 34 (21) | 12.6 ± 5.6 | 40.7 ± 17.4 |
BSA: body surface area, CMIA: Chemiluminescent microparticle immunoassay, EMIT: enzyme multiplied immunoassay technique, HPLC/MS: high performance liquid chromatography/mass spectrometry, HPLC-MS/MS: high performance liquid chromatography with tandem mass spectrometry, HPLC/UV: high performance liquid chromatography/ultraviolet, Inf: infusion, IV: intravenous, KHE: kaposiform hemangioendothelioma, KT: kidney transplant, LCMS/MS: liquid chromatography with tandem mass spectrometry, Med: median, MEIA: microparticle enzyme immunoassay, Mth: month, TDM: therapeutic drug monitoring, Wk: week.
Population Pharmacokinetic Model Development and Model Evaluation
Most studies conducted a PopPK model using NONMEM® software, except for four studies in which Phoenix NLME,25,29 Monolix,35 and P-Pharm15 were used. Ten studies developed a model with a 1-compartment structure,9, 18–20,24,27–29,35,36 while nine studies used a 2-CMT disposition,15,17,21,22,25,26,33,34,37 and the other one that explored the developmental trajectory of CLSRL employed a sigmoidal Emax model.23 The first-order absorption process was used in all models, except studies by Djebli et al.17 and Wu et al.21 in which the Erlang distribution and the Michaelis-Menten kinetics were used to explain the absorption process. In addition, one study reported an absorption lag-time of 0.24 h.16 Eight studies9,19, 20,24,27–29,36 had to fix the absorption rate constant (ka) at 0.485, 0.752, 2.2, or 2.77 h−1 since the information during the absorption phase was insufficient to estimate ka, whereas the estimated ka ranged from 0.0535 to 2.65 h−1, with the IIV ranging from 17.5% to 80.0%. The estimated CLSRL without covariate effects ranged from 3.2 to 14.4 L/h, with a wider IIV range than the ka (11.4% to 103.0%). As for the Vd, the estimated values ranged from 88.9 to 3670 L for those with the 1-compartment structure, with the magnitude of IIV of 5.5% to 115.5%. While for the 2-compartment models, the central (Vc) and peripheral (Vp) volumes of distribution were in the range of 26.9 to 676.0 L and 72.8 to 1380 L, with the respective IIV of 7.8% to 164.0% and 10.3% to 38.7%. Concerning the statistical model, the IIV was modeled using an exponential relationship in all studies, except for one study in which an additive model was employed,15 while the proportional model was the most commonly used relationship for the RV, followed by a combined additive and proportional relationship.
Effects of numerous covariates on SRL pharmacokinetics were tested (Table 2), including age, body size (i.e., weight, height, body mass index; BMI, and body surface area; BSA), sex, SRL dose, TEM dose, duration of SRL therapy (DTT), enzyme polymorphisms, concurrent medication, postoperative days, and various laboratory measures such as hemoglobin (Hb), hematocrit (Hct), red blood cell (RBC), white blood cell (WBC), platelet, mean corpuscular hemoglobin (MCH), mean corpuscular hemoglobin concentration (MCHC), aspartate aminotransferase (AST), alanine aminotransferase (ALT), alkaline phosphatase (ALP), albumin (ALB), total protein (TP), bilirubin (BIL), serum creatinine (SCr), creatinine clearance (CLCR), total cholesterol (TC), triglyceride (TG), high-density lipoprotein (HDL), low-density lipoprotein (LDL), and glucose. Other investigated covariates included study site, ethnicity, graft origin, tumor age, dialysis before transplant, and the presence of ischemic heart disease (IHD). Of the tested covariates, weight was the significant covariate most commonly identified, whereas CYP3A5 polymorphisms and age were the second most commonly identified significant covariates. Other factors significantly affecting SRL pharmacokinetics were gender, BSA, height, cyclosporine concentration at time 0 h (CsA C0), TEM dose, TG, TC, Hct, ALB, AST, ALT, and BIL.
Table 2. Tested covariates for sirolimus pharmacokinetics.
| No | Author | Tested Covariates | ||||||||||||||
|---|---|---|---|---|---|---|---|---|---|---|---|---|---|---|---|---|
| Age | Body size | Sex | Blood profile | LFT | Lipid profile | Protein | Urea | BIL | RFT | SRL dose | CsA dose/conc. | Polymorphism | Concurrent med | Other | ||
| 1 | Ferron et al., 199715 | ✓ | WT, HT, BSA | ✓ | ✓ | Study site | ||||||||||
| 2 | Boni et al., 200533 | NR | NR | NR | NR | NR | NR | NR | NR | NR | NR | NR | NR | NR | NR | NR |
| 3 | Djebli et al., 200617 | ✓ | WT, HT, BMI, BSA | HCT, HB, RBC, WBC, platelet | AST, ALT | TC, TG | TP, ALB | ✓ | SCr | CYP3A5, CYP3A4, MDR1 | ||||||
| 4 | Sato et al., 200618 | ND | ND | ND | ND | ND | ND | ND | ND | ND | ND | ND | ND | ND | ND | ND |
| 5 | Zahir et al., 200619 | ✓ | WT | ✓ | HCT, RBC | TC, TG, HDL, LDL | TP, ALB | ✓ | Ethnicity, IHD, POD | |||||||
| 6 | Jiao et al., 200920 | ✓ | WT, HT, BMI, BSA | ✓ | HCT, HB, RBC, WBC | AST, ALT | TC, TG, HDL, LDL | ✓ | SCr, CLCR | ✓ | ✓ | ✓ | Organ source, POD | |||
| 7 | Wu et al., 201221 | ✓ | WT, HT | ✓ | HCT, HB, RBC, WBC, platelet | AST, ALT, ALP | TC, TG | TP, ALB | ✓ | ✓ | SCr, CLCR | Glucose | ||||
| 8 | Goyal et al., 201322 | ✓ | ✓ | HB | AST, ALT | ALB | ✓ | ✓ | SCr | |||||||
| 9 | Shi et al., 20169 | NR | NR | NR | NR | NR | NR | NR | NR | NR | NR | NR | NR | NR | NR | NR |
| 10 | Emoto et al., 201623 | ND | ND | ND | ND | ND | ND | ND | ND | ND | ND | ND | ND | ND | ND | ND |
| 11 | Mizuno et al., 201634 | ✓ (for TEM) | ✓ (for TEM) | TEM dose | ||||||||||||
| 12 | Mizuno et al., 201724 | NR | NR | NR | NR | NR | NR | NR | NR | NR | NR | NR | NR | NR | NR | NR |
| 13 | Wang et al., 201637 | ✓ | WT, HT, BMI | ✓ | AST | ✓ | ✓ | SCr | ✓ | population | ||||||
| 14 | Peng et al., 201825 | ✓ | WT, HT, BSA | ✓ | HCT, HB, RBC, platelet | AST, ALT | TC, TG | TP, ALB | ✓ | SCr | CYP3A5, MDR1 | |||||
| 15 | Golubovic et al., 201926 | ✓ | WT | ✓ | HCT | AST, ALT, ALP | TC, TG | TP | SCr | ✓ | Graft origin, dialysis before transplant | |||||
| 16 | Wang et al., 201927 | ✓ | WT | ✓ | HCT, HB | AST, ALT | ✓ | SCr | ✓ | ✓ | Duration of treatment with SRL | |||||
| 17 | Chen et al., 202028 | ✓ | ✓ | HCT, HB, MCH, MCHC | AST, ALT | TP, ALB | ✓ | SCr | CYP3A5 | ✓ | ||||||
| 18 | Chen et al., 202029 | ✓ | WT | ✓ | HCT, HB, RBC, platelet | AST, ALT, ALP | TC, TG, LDL | ALB | ✓ | ✓ | SCr | |||||
| 19 | Wang et al., 202036 | ✓ | WT | ✓ | HCT, HB, MCH, MCHC | AST, ALT | TP | ✓ | ✓ | SCr | ABCB1, ABCC4, ABCC8, ABCG2, CYP2C9, CYP2C19, CYP3A4, CYP3A5, CYP4F2, UGT1A1, UGT1A8, UGT2B15 | |||||
| 20 | Sabo et al., 202135 | ✓ | WT, HT, BMI, BSA | ✓ | Tumor age, CNS tumor diagnostic, irinotecan dose on day 1, glucose | |||||||||||
ABC: ATP binding cassette, ALB: albumin, ALP: alkaline phosphatase, ALT: alanine aminotransferase, AST: aspartate aminotransferase, BIL: bilirubin, BMI: body mass index, BSA: body surface area, CLCR: creatinine clearance, CsA: cyclosporine, CYP: cytochrome P450, HB: hemoglobin, HCT: hematocrit, HDL: high density lipoprotein, HT: height, IHD: ischemic heart disease, LDL: low density lipoprotein, LFT: liver function test, MCH: mean corpuscular hemoglobin, MCHC: mean cell hemoglobin concentration, MDR1: multidrug resistant protein 1, ND: not determined, NR: not reported, POD: postoperative day, RBC: red blood cell, RFT: renal function test, SCr: serum creatinine, SRL: sirolimus, TC: total cholesterol, TEM: temsirolimus, TG: triglyceride, TP: total protein, UGT: Uridine 5’-Diphospho-Glucuronosyl Transferase, WBC: white blood cell, WT: weight.
As for the model evaluation, all studies used basic and advanced internal approaches; however, one study assessed the model based solely on the basic internal method,22 and the other one employed all types of model evaluation techniques.26 Two studies did not have information on the model evaluation.15,18 Software, structural models, and model evaluation are presented in Table 3, while Table 4 summarizes the final models of the included studies and their magnitudes of IIV and RV.
Table 3. Software, structural models, and model evaluation.
| No | Author | Software | Structural model | Model evaluation |
|---|---|---|---|---|
| 1 | Ferron et al., 199715 | P-Pharm | 2-CMT with first-order absorption and Lag-time | NR |
| 2 | Boni et al., 200533 | NONMEM | 2-CMT with first-order formation into the central CMT (SRL was model as a metabolite of TEM) | Basic and advanced internal evaluation |
| 3 | Djebli et al., 200617 | NONMEM | 2-CMT with Erlang distribution and first-order elimination | Basic and advanced internal evaluation |
| 4 | Sato et al., 200618 | NONMEM | 1-CMT with first-order elimination | NR |
| 5 | Zahir et al., 200619 | NONMEM | 1-CMT with first-order absorption and elimination | Basic and advanced internal evaluation |
| 6 | Jiao et al., 200920 | NONMEM | 1-CMT with first-order absorption and elimination | Basic and advanced internal evaluation |
| 7 | Wu et al., 201221 | NONMEM | 2-CMT with Michaelis-Menten absorption and first-order elimination | Basic and advanced internal evaluation |
| 8 | Goyal et al., 201322 | NONMEM | 2-CMT with first-order absorption and elimination | Basic internal evaluation |
| 9 | Shi et al., 20169 | NONMEM | 1-CMT with first-order absorption and elimination | Basic and advanced internal evaluation |
| 10 | Emoto et al., 201623 | NONMEM | Sigmoidal Emax | Basic and advanced internal evaluation |
| 11 | Mizuno et al., 201634 | NONMEM | Temsirolimus: 3-CMT with zero-order infusion Sirolimus (as a metabolite): 2-CMT with first-order elimination |
Basic and advanced internal evaluation |
| 12 | Mizuno et al., 201724 | NONMEM | 1-CMT with first-order input | Basic and advanced internal evaluation |
| 13 | Wang et al., 201637 | NONMEM | 2-CMT with first-order absorption and elimination | Basic and advanced internal evaluation |
| 14 | Peng et al., 201825 | Phoenix NLME | 2-CMT with first-order absorption and elimination | Basic and advanced internal evaluation |
| 15 | Golubovic et al., 201926 | NONMEM | 2-CMT with first-order absorption and elimination | Basic and advanced internal and external evaluation |
| 16 | Wang et al., 201927 | NONMEM | 1-CMT with first-order absorption and elimination | Basic and advanced internal evaluation |
| 17 | Chen et al., 202028 | NONMEM | 1-CMT with first-order absorption and elimination | Basic and advanced internal evaluation |
| 18 | Chen et al., 202029 | Phoenix NLME | 1-CMT with first-order absorption and elimination | Basic and advanced internal evaluation |
| 19 | Wang et al., 202036 | NONMEM | 1-CMT with first-order absorption and elimination | Basic and advanced internal evaluation |
| 20 | Sabo et al., 202135 | Monolix | 1-CMT with first-order absorption and elimination | Basic and advanced internal evaluation |
CMT: compartment, NR: not reported, SRL: sirolimus, TEM: temsirolimus.
Table 4. Final models, interindividual variability, and residual variability.
| No | Authors | Final model | RV (%CV) | |||||
|---|---|---|---|---|---|---|---|---|
| Absorption | IIV (%CV) |
Distribution | IIV (%CV) |
Elimination | IIV (%CV) | |||
| 1 | Ferron et al., 199715 | ka (h-1) = 2.18 | 41.3% | Vc (L) = 112.9 | 31.8% | CL/F (L/h) = 8.91 | 38.2% | Prop: NR |
| tlag (h) = 0.24 | 40.1% | Vp (L) = 452 | 26.4% | |||||
| 2 | Boni et al., 200533 | ka (h-1) = 0.087 | 34.6% | Vc (L) = 10.4 | 164% | CL (L/h) = 2.05*Dose0.422 | 63.7% | Prop: 23.24% |
| Vp (L) = 12.9*Dose0.302*HCT0.719 | 22.8% | Q (L/h) = 44.1 | NR | |||||
| 3 | Djebli et al., 200617 | ktr (h-1) = 5.25 | 42.7% | Vc/F (L) = 218 | 52.7% | CL/F(L/h) = 14.1 + 14.2*CYP3A5 | 49.3% | Prop: 5.86% Add: 3.08 ng/mL |
| Vp/F (L) = 292 | 20.2% | Q/F (L/h) = 38.7 | 78.1% | |||||
| 4 | Sato et al., 200618,ε | NA | NA | V/F (L) = 790 ± 659 | NA | CL/F (L/h) = (0.0776 + 0.167*POD/12)*WT for POD ≤ 12 | NA | NA |
| CL/F (L/h) = (0.0776 + 0.167)*WT for POD > 12 | ||||||||
| 5 | Zahir et al., 200619 | ka (h-1) = 0.752 (fixed) | NA (fixed) | V/F (L) = 1350 | NR | CL/F (L/h) = 7.09 - 0.0147*CsA dose-1.37*(1-TG) + 2.2*(1-IHD) | 27.5% | Add: 24.1% |
| 6 | Jiao et al., 200920 | ka (h-1) = 0.752 (fixed) | NA (fixed) | V/F (L) = 3670-7.27*(CsA C0-104) | 56.7% | CL/F (L/h) = [10.1-0.662*(TC-5.66)-0.00417*(CsA C0-104)] *0.65SLM *0.661GLZ *(DDS/2)0.479 | 23.8% | Expo: 29.9% |
| 7 | Wu et al., 201221 | Vmax(µg/L*h) = 4.56 | NE | Vc/F (L) = 53.4 | 52.4% | CL/F (L/h) = 12.9*(35.1/HCT)0.14 | 52.4% | Prop: 2.17% Add: 0.5 ng/mL |
| Km (mg) = 13.8 | NE | Vp/F (L) = 611 | 19.3% | Q/F (L/h) = 29.0 | 52.4% | |||
| 8 | Goyal et al., 201322 | ka (h-1) = 0.0535±0.0104 | NR | Vc/F (L) = 26.9±7.7 | 91% | CL/F (L/h) = 6.66±1.10 | 78% | Prop: 21% Add: 0.84 ng/mL |
| Vp/F (L) = 630±171 | NR | Q/F (L/h) = 4.62±2 | NR | |||||
| 9 | Shi et al., 20169 | ka (h-1) = 2.20 (fixed) | NA (fixed) | Vd/F (L) = 322 | 22.6 | CL/F (L/h) = 14.4*(1+WT/58.6*0.19)*exp((-ALB/38.9)*0.26)*exp(CYP3A5*-0.30) | 19.6 | Expo: 25.6% |
| 10 | Emoto et al., 201623 | CL = CLmatured * PMAHill/+ PMAHill CLmatured (L/h/70 kg) = 18.7 |
11.3% | Prop: 25.7% | ||||
| TM50 (weeks) = 62.9 | 17.4% | |||||||
| Hill = 2.94 | 102% | |||||||
| 11 | Mizuno et al., 201634 | CLTEM (L/h/70 kg) = 3.4*Dose0.855 | 70.9% | Vc (L/h/70kg) = 48 | 121% | CLSRL (L/h/70kg) = 6.08 | 103% | Prop: 25.5% Add: 1.69 ng/mL |
| Vp (L/h/70kg) = 72.8 | NE | Q (L/h/70kg) = 11.6 | NE | |||||
| 12 | Mizuno et al., 201724 | ka (h-1) = 2.77 fixed | NA (fixed) | Vpediatric = Vadult*(BW/70) Vadult = 1030 |
62.3% | CLpediatric = CLadult*(BW/70)0.73*MF MF = PMAHill/(0 + PMAHILL) CLadult = 18.5 Hill = 2.94 |
31.2% | Prop: 38.1% |
| 13 | Wang et al., 201637 | ka (h-1) = 0.24 | 0 | Vc/F (L) = 676*(SCR/592.3)1.4 | 10.3% | CL/F (L/h) = 8.81*[1-0.219*(CsA/300)] * [1-0.0171*(age-40)] | 50.9% | Prop: 62.2% |
| Vp/F (L) = 1380 | 103.4% | Q/F (L/h) = 32.9 | 12.7% | |||||
| 14 | Peng et al., 201825 | ka (h-1) = 2.651 | Vc = 184.461 for female Vc = 184.461*exp(0.266) for male |
7.8 | CL = 10.813*(CYP3A5*1/*1) CL = 10.813*exp(-0.034)*(CYP3A5*1/*3) CL = 10.813*exp(-0.250)*(CYP3A5*3/*3) |
11.4% | Prop: 17.5% | |
| Vp = 170.029*BSA2.165 | 38.7 | Q (L/h) = 23.596 | 7.6% | |||||
| 15 | Golubovic et al., 201926 | ka (h-1) = 2.19 | 38.1% | Vc/F (L) = 118 | 55.3 | CL/F (L/h) = 12.2*0.63AST*(1-(age/44)*0.388) AST = 0 if =< 37 IU/L AST=1 if >37 IU/L |
23.4% | Prop: 24.9% Add: 1.93 ng/mL |
| Vp/F (L) = 609 | 25.6 | Q/F (L/h) = 5.07 | 32.1% | |||||
| 16 | Wang et al., 201927 | ka (h-1) = 0.485 (fixed) | NA (fixed) | V/F (L) = 165*exp(0.0783*DTT/10) | 115.5 | CL/F (L/h) = 3.19*exp(0.215*age)*exp(0.0108*ALT)*exp(-0.818*sex) Sex = 1 for female, 0 otherwise |
46.6% | Expo: 60.4% |
| 17 | Chen et al., 202028 | ka (h-1) = 0.485 (fixed) | NA (fixed) | V/F (L) = 1840*(WT/70) | NR | CL/F (L/h) = 7.55*(WT/70)0.75*(1-(-0.999)*CYP3A5) | 59.0% | Prop: 62.4% |
| 18 | Chen et al., 202029 | ka (h-1) = 0.752 (fixed) | NA (fixed) | V/F (L) = 144.16 | 42.9% | CL/F (L/h) = 5.63*(TBIL/11.29)-0.32*(WT/28.5)0.5 | 21.9% | NR: 11.8% |
| 19 | Wang et al., 202036 | ka (h-1) = 0.485 (fixed) | NA (fixed) | V/F (L) = 124*(WT/70) | 5.5% | CL/F (L/h) = 6.48*(WT/70)0.75 | 25.7% | Prop: 55.9% Add: 1.25 ng/mL |
| 20 | Sabo et al., 202135 | For day 1: ka (h-1) = 0.46 | 80% | For day 1: V/F (L/h) = 88.9*(BSAi/Med BSA)1.35 | 62.5% | For day 1: CL/F (L/h) = 23.9*(BSAi/Med BSA) | 92.9% | Prop: Day 1: 0.54% |
| For day 8: ka (h-1) = 0.97 | 168.5% | For day 8: V/F (L/h) = 238*(BSAi/Med BSA)1.41 | 29.4% | For day 8: CL/F (L/h) = 11.9*(BSAi/Med BSA)1.09 | 50.1% | Prop: Day 8: 0.31% | ||
εThis study compared two models and did not determine the magnitude and sources of variability ALB: albumin, AST: aspartate aminotransferase, BSA: body surface area, BSAi: individual body surface area, CL: clearance, CLmatured: clearance at fully matured level, CsA C0: cyclosporine trough concentration, CsA: Cyclosporine, CYP: cytochrome P450, DDS: daily dose sirolimus, F: bioavailability, GLZ: glycyrrhizin, HCT: hematocrit, IHD: ischemic heart disease, ka: absorption rate constant, km: sirolimus amount at 50% of Vmax, ktr: transfer rate constant, Med: median, MF: maturation function, NA: not applicable, NE: Not estimated, PMA: postmenstrual age, POD: postoperative day, Q: intercompartmental clearance, SLM: silymarin, SRL: sirolimus, TBIL: total bilirubin, TC: total cholesterol, TEM: temsirolimus, TG: triglyceride, tlag: absorption lag time, TM: postmenstrual age at which clearance is half of CLmatured, Vc: central volume of distribution, Vmax: maximum absorption rate, Vp: peripheral volume of distribution, WT: weight.
Transparent Report of the Included Studies
Most studies complied with the guideline of the transparent report for clinical pharmacokinetic studies,31,32 with a compliance rate greater than 80%. Only one study had a compliance rate of approximately 60%,18 while four studies reported their results with compliance rates between 70% to 80%.16,29,36,38 The most common non-reported items of each section, identified in more than 10 studies were “route of administration” in the introduction section, “formulation details” and “sample storage” in the method section, and “study withdrawals or lost to follow-up” in the result section.
DISCUSSION
Several PopPK models of SRL have been conducted to determine factors influencing its pharmacokinetic variability. The impacts of these factors on SRL pharmacokinetics were summarized and discussed below.
Absorption
The rate of SRL absorption was variable, with the estimated ka ranging from 0.0535 to 2.65 h−1, which was consistent with a traditional pharmacokinetic study in stable transplant patients that reported a wide range of Tmax of 0.5–3 h.39 The difference in ka among studies could not be clearly explained, however, it has been reported that administration of SRL with food results in a 3.5-fold increase in Tmax, while the maximum concentration (Cmax) is decreased by 34%.1 The administration process of some of the included studies, e.g., fasted or fed, was not described and might contribute to such difference. Though the magnitude of IIV on ka ranged from 17.5% to 80.0%, no studies identified significant predictors for ka, and this was consistent with a study by Kahan et al. that reported no association between sex, age, weight, or ethnicity and Cmax, the minimum concentration at steady-state (Cmin,ss), or AUC.14 Notably, the slowest ka of 0.0535 h−1 was reported by a study conducted in pediatric bone marrow transplant patients whose ages ranged from 4 years to 22 years, and some patients were co-administered fluconazole.22 It has been shown that neonates and infants have longer gastric emptying, which can delay the rate of drug absorption, however, the age at which gastric emptying time approaches that in adults was not specifically determined.40
Distribution
The estimated Vd for the 1-compartment studies ranged from 88.9 L to 1840 L, excluding the one with a substantially high value of 3670 L, while those of the 2-compartment studies had the Vd of 120.8 L to 2056 L. The large Vd of SRL can be explained by its lipophilic property, which contributes to the distribution of the lipid membrane of various tissues.5 The ranges of Vd from SRL PopPK studies were more comprehensive than those of the traditional pharmacokinetics conducted in stable renal transplant patients (392 L to 1169 L for a 70 kg patient),8 which could be due to different patients’ characteristics. PopPK studies that reported the low Vd values (88.9 L to 165 L) were conducted in children,27,29,35,36 and evidence has indicated that children contain lower fat mass than adults.41
Significant predictors for SRL Vd included CsA C0,20 weight,24,28,36 BSA,35 Scr,37 sex,25 and DTT.27 Jiao et al.20 indicated that 1 ng/mL increase in CsA C0 from the median value of 104 ng/mL resulted in a decrease in the apparent volume of distribution (Vd/F) of 7.27 L. CsA is a substrate and an inhibitor of intestinal CYP3A4 and P-gp,42 thus co-administration of CsA and SRL increased SRL bioavailability, and in turn, a decrease in Vd/F.
The effect of weight on Vd was explained using an allometric scaling relationship with the exponent of one, suggesting that the Vd is linearly related to weight. This relationship is well accepted since it is based on physiologic principles describing size in relation to blood volume and vital capacity.43 Another study; however, used BSA instead of weight as an index of body size with the exponent of 1.35 and 1.09 for Vd on day 1 and Vd on day 8.35 This was deemed feasible since this study was conducted in pediatric patients with solid tumors in which SRL dose was titrated based on BSA.
Wang et al. reported a nonlinear increase in Vc/F with an increase in SCr.37 This could be rationalized by a decrease in plasma protein binding in patients with impaired renal function,44 increasing free SRL concentrations that can distribute to red blood cells. Moreover, Peng et al. reported higher Vc of SRL in males than in females, which was expected given that males generally have larger body configurations than females.25 As for the DTT, Vd of SRL increased as the DTT increased, which could be due to an increase in the number of erythrocytes with the improvement of clinical outcomes as the duration of treatment was lengthened.27
Elimination
Significant predictors for CLSRL were different among studies. Jiao et al.20 reported a nonlinear increase in CLSRL/F with an increase in SRL dose. However, this could be due to the TDM effects since subjects with higher CLSRL/F tend to receive higher SRL doses. This effect was previously described by Ahn et al.45 Boni et al.33 also reported a similar effect using a model conducted in patients with advanced renal cancer receiving TEM, in which CLSRL increased with an increase in TEM dose.
Several studies found a significant effect of CsA on CLSRL. Zahir et al.19 identified that a 100 mg increase in CsA dose led to approximately 20.7% decrease in CLSRL/F, while Wang et al.37 reported a smaller effect of a 7.3% decrease in CLSRL/F. Moreover, Jiao et al.20 found a 4.5% decrease in CLSRL/F for a 100 ng/mL increase in CsA C0. CsA is an inhibitor of CYP3A4 and P-gp. Thus concomitant administration of CsA and SRL leads to an increase in SRL bioavailability and in turn, a decrease in CLSRL/F.42 Therefore, in patients undergoing CsA dose minimization, the SRL dose should be increased by 7% to 20% for a 100 mg decrease in the CsA dose.
Significant effects of several laboratory values were identified. First, an increase in Hct contributed to a modest decrease in CLSRL/F.21 This effect was previously reported for tacrolimus.46 Since SRL is concentrated in erythrocytes,7 as Hct increases, free SRL levels available for elimination decrease. Second, CLSRL/F is decreased as TC20 or TG increases.19 This could be due to increased SRL bioavailability following high-fat meals since patients with hyperlipidemia tend to consume high-fat meals.19,20 Zahir et al.19 also proposed that SRL may be a low intrinsic clearance drug in which hepatic clearance depends on fraction unbound. Patients with hyperlipidemia may have a lower unbound SRL fraction since the drug extensively distributes across the plasma membrane and binds to erythrocytes, decreasing hepatic clearance. The authors also reported that heart transplant patients with non-IHD had lower CLSRL/F than IHD patients, which might also be associated with dyslipidemia since IHD patients tend to consume a high-fat diet. Nonetheless, this covariate (IHD) can be confounded by the effect of TG and should be interpreted with a caveat. Third, a one-fold of ALB lower than average level contributed to a modest increase in CLSRL/F of 17%.9 This would be expected since it increased the free SRL fraction available for elimination. Fourth, and impaired liver function, expressed as AST above upper limit normal contributed to lower CLSRL/F,26 which is not surprising given that SRL is extensively metabolized by the liver. Fifth, Cheng et al. reported that the higher BIL was associated with, the lower CLSRL/F; however, underlying mechanism of this effect could not be clarified.29
Several studies identified a significant association between weight and CLSRL/F, with an increase in CLSRL/F with bodyweight.9,24,28,29,36 This association is commonly described using a power relationship43 and is widely applied since higher body weight may relate to larger elimination organs. Whereas Sabo et al.35 reported a significant association between BSA and CLSRL/F in pediatric patients with solid tumors using a power relationship, which is deemed appropriate given that SRL dose is given based on BSA in patients with cancer. Moreover, one study reported that females had approximately 40% lower CLSRL/F than males,27 which is incongruent with a physiological basis that females have lower body weight, corresponding to smaller elimination organs.
Glolubovic et al. identified that CLSRL/F of adults decreased with advancing age,26 which is in agreement with physiological basis, while Wang et al.27 reported an increase in CLSRL/F with age in a pediatric population aged 0.2-6 years. This was expected based on the development of elimination organs that approaches adults with increasing age. Moreover, Emoto et al.23 described the developmental trajectory of CLSRL in neonates and infants using postmenstrual age (PMA) and a sigmoidal Emax model, which could aid dosing recommendations in this population. Based on their model, CLSRL approached the mature level at the PMA of approximately 144-196 weeks.
CYP3A5 polymorphisms significantly influence CLSRL/F, as Djebli et al.17 and Chen et al.28 found that non-expressers (CYP3A5*3/*3) had approximately 50% lower CLSRL/F than expressers (CYP3A5*1/*1 and CYP3A5*1/*3). With a similar trend, Shi et al.9 and Peng et al.25 reported that patients carrying CYP3A5*1/*1, CYP3A5*1/*3, CYP3A5*3/*3 had a ratio of CLSRL/F of 1: 0.74: 0.55 and 1: 0.96: 0.78, respectively. This effect could assist SRL dosing when CYP3A5 genotyping is available.
In conclusion, PopPK models of SRL conducted using a nonlinear mixed-effects approach were summarized, and significant predictors for CLSRL were identified. These models, with Bayesian forecasting, can be used to guide SRL dosage individualization. However, the choice of model selection should be based on the characteristics of the target population in which the model is to be used. Moreover, most models were not externally evaluated. Therefore, the predictive performance of such models should be assessed before applying them in clinical practice.